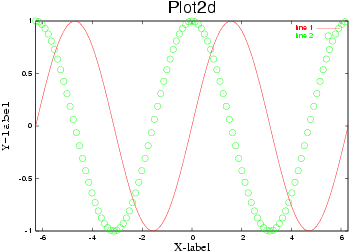
2次元グラフ: gplot
############################################################ # Gnuplot 風で記述してます. ############################################################ cosx = load "cos.dat"; x = (-2*pi:pi/25:2*pi)'; sinx = [x,sin(x)]; gset xlabel "X-label" font "Times,24" gset ylabel "Y-label" font "Courier,24" gset title "Plot2d" font "Helvetica,34" gset pointsize 2 gplot [-2*pi:2*pi] sinx, cosx w points 2 6 pause -1 gset terminal postscript color eps gset output "plot2d.eps" replot |
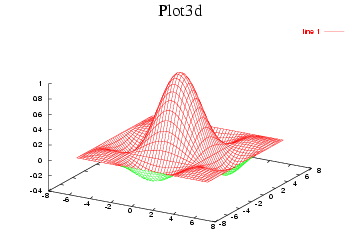
3次元グラフ: gsplot z, mesh(x,y,z)
############################################################ # gsplot z(i,j) では2次元行列を渡すので,x,y の範囲が配列の # 添え字となってしまいます. # mesh(x,y,z) は向きが固定のようです ############################################################ x=(-2*pi:pi/11:2*pi)'; y=x'; z=(sin(x)./x)*(sin(y)./y); gset title "Plot3d" font "Times,34" gset ticslevel 0 gset hidden3d gsplot z pause -1 mesh(x,y,z) pause -1 gset term postscript eps color gset output 'plot3d.eps' replot |
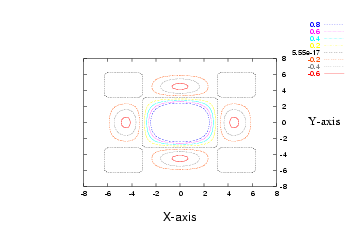
等高線図: gsplot
############################################################ # gsplot z(i,j) では,x,y の範囲が配列の添え字となってしまい # ます.従って,いったん table 形式のデータファイルを作成して, # gsplot 'contour.dat' で描くことにしました. # contour(x,y,z,n) があるのですが,使い方が判らないです. ############################################################ x=(-2*pi:pi/11:2*pi)'; y=x'; z=3*(sin(x)./x)*(sin(y)./y); gset xlabel "X-axis" "Helvetica,24" gset ylabel "Y-axis" "Times,24" gsplot z pause -1 gset term table gset out 'contour.dat' mesh(x,y,z) gset term x11 gset out gset nosurface gset view 0,0,, gset contour gset cntrparam level incr -1,0.2,1 gsplot 'contour.dat' pause -1 gset term postscript eps color gset output 'contour.eps' replot |
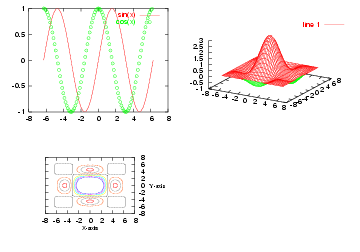
マルチプロット: multiplot(nx,ny),subwindow(nx,ny)
############################################################
# multiplot(Nx,Ny) でページをパネルに分割して,
# subwindow(nx,ny) で指定されたパネルに移動します.
# この方法は gnuplot より楽になっています.
############################################################
cosx = load "cos.dat";
x=(-2*pi:pi/11:2*pi)';
sinx = [x,sin(x)];
y=x';
z=3*(sin(x)./x)*(sin(y)./y);
title("Multi Plot");
gset term table
gset hidden3d
gset ticslevel 0
gset out 'contour.dat'
mesh(x,y,z)
gset term postscript eps color
gset output 'multi.eps'
multiplot(2,2)
gplot sinx t 'sin(x)', cosx t 'cos(x)' w p 2 6
subwindow(2,1)
mesh(x,y,z)
subwindow(1,2)
gset xlabel "X-axis" "Helvetica,12"
gset ylabel "Y-axis" "Times,12"
gset nokey
gset nosurface
gset view 0,0,,
gset contour
gset cntrparam level incr -1,0.2,1
gsplot 'contour.dat'
|