|
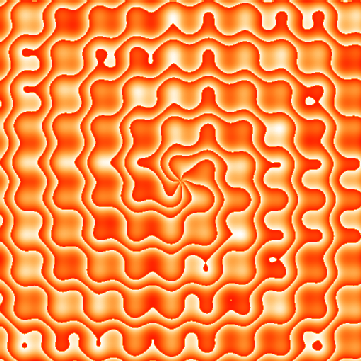
p(x,y)=sqrt(x**2+y**2)+3.5*atan2(y,x)+sin(x)+cos(y) n1(x,y)=floor(p(x,y)/pi) n2(x,y)=floor(p(x,y)/pi/7) f(x,y)=p(x,y)-pi*n1(x,y) g(x,y)=p(x,y)-7*pi*n2(x,y) < pi/2 ? 2: p(x,y)-pi*n1(x,y) < pi/2 ? 1: 0 set pm3d map unset key unset border unset xtics unset ytics unset colorbox set ticslevel 0 set size square set palette rgb 2,-3,-5 set samples 512 set isosamples 512,512 R=30 set term png tiny crop # set out "g001.png" splot [-R:R][-R:R] g(x,y) # set out "f001.png" splot [-R:R][-R:R] f(x,y) # set palette rgb 7,5,15 set out "f001c.png" splot [-R:R][-R:R] f(x,y) |