|
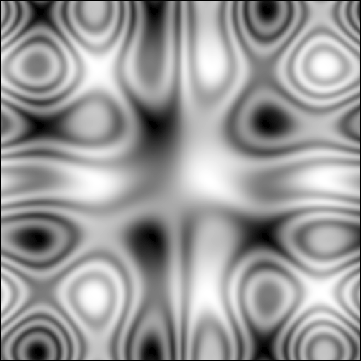
f(x,y)=sin(x)+cos(y)+sin(x*cos(y)+y*sin(x)) g(x,y)=f(x,y)>0 ? 0: 1 set pm3d map unset colorbox set palette gray set size square unset key unset xtics unset ytics set samples 512 set isosamples 512,512 set term png tiny crop R=10 # set out "g003.png" splot [-R:R][-R:R] g(x,y) # set out "f003.png" splot f(x,y) # set palette color set out "f003c.png" splot f(x,y) |