set fit logfile "gaussfit.log"
set xrange [0:1]
set samples 200
seed = rand(time(0))
unset key
set table "testfit.dat"
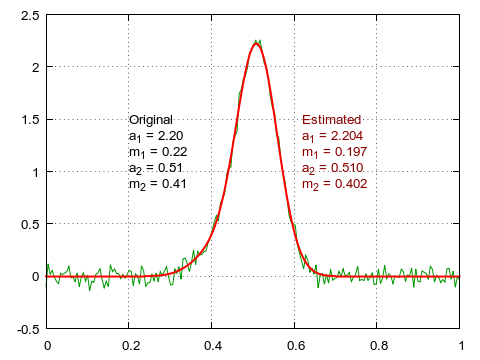
f(x,a,m,s) = a*exp(-(x-m)**2/s)
A = 2.2; M = 0.51; S = 0.005;
plot f(x,A,M,S) + f(x,A*0.1,M-0.1,S) + (sum [i=1:6] rand(0) - 0.5)/12
unset table
a1 = 2.2 # 生データから推測できる
m1 = 0.5 # メインピークのパラメータ概値
m2 = 0.5 # サブピークが近くにある
fit [0.2:0.8] f(x,a1,m1,S)+f(x,a2,m2,S) "testfit.dat" via a1,a2,m1,m2
set label \
sprintf("Original\na_{1} = %.2f\nm_{1} = %.2f\na_{2} = %.2f\nm_{2} = %.2f",\
A, A*0.1, M, M-0.1) at 0.2,1.5
set label \
sprintf("Estimated\na_{1} = %.3f\nm_{1} = %.3f\na_{2} = %.3f\nm_{2} = %.3f",\
a1, a2, m1, m2) at 0.62,1.5 tc rgb "dark-red"
set grid
set term pngcairo enh font "Arial,10" size 480,360
set out "fit_gaussian.png"
plot "testfit.dat" w l lc rgb "#009900", \
f(x,a1,m1,S)+f(x,a2,m2,S) lt 1 lw 2
|