|
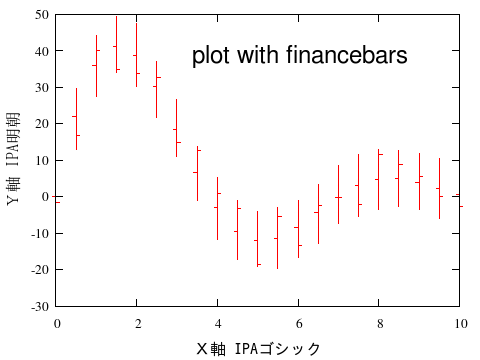
f(x) = 100*besj1(x)*exp(-x/5) dummy = rand(time(1)) set bars 2 set samples 21 set xrange [0:10] set yrange [-30:50] unset key set term pngcairo enh font "Times, 10" size 480,360 set out "plot_financebars.png" set label "plot with financebars" at sc 0.4, 0.85 font "Helvetica,18" set xlabel "X軸 IPAゴシック" font "IPAGothic,12" set ylabel "Y軸 IPA明朝" font "IPAMincho,12" plot '+' \ u 1:(f($1)):(f($1)-7-rand(0)*2):(f($1)+7+rand(0)*2): (f($1)+rand(0)*14-7)\ w financebars |