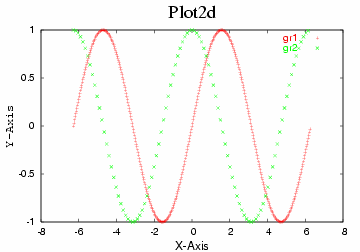
2次元グラフ: plot
pi=acos(-1);
x=(-2*pi:2*pi:0.01*pi)';
gr1=[x,sin(x)];
gr2=readnum(100,2;"cos.dat");
plot({gr2;gr1});

# Gnuplot には Algae が名前をソートして渡すらしい.

# replot() は現在アクテイブな Gnuplot にさらにコマンドを
# 渡して最後に replot させる.

replot("set title 'Plot2d' font 'Roman,36'\n \
        set xlabel 'X-Axis' font 'Helvetica,24'\n \
        set ylabel 'Y-Axis' 1,0 font 'Courier,24'");
replot("set term postscript eps color 'Helvetica' 20\n \
        set out 'plot2d.eps'");

# このままでは直に終了してしまい X11 に描かれた図も一瞬で
# 消えてしまう.system("sleep 1000") でも良いが,
#
# $ algae plot2d.A -
#
# とすると,plot2d.A を読み込んで実行した後,標準入力から
# コマンド待ちとなるので,図を確認して
#
# > exit()
#
# すれば良い.
|
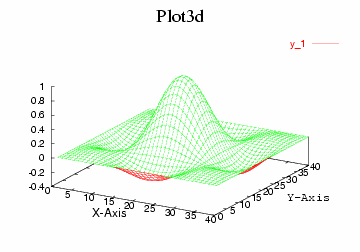
3次元グラフ: splot
pi=acos(-1);
x=(-2*pi:2*pi:4*pi/39)';
y=matrix(-2*pi:2*pi:4*pi/39);
gr1=(sin(x)*sin(y))/(x*y);

splot("set style data lines\n \
      set hidden3d"; gr1);

replot("set title 'Plot3d' font 'Roman,36'\n \
        set xlabel 'X-Axis' font 'Helvetica,24'\n \
        set ylabel 'Y-Axis' 1,0 font 'Courier,24'");
replot("set term postscript eps color 'Helvetica' 20\n \
        set out 'plot3d.eps'");
|
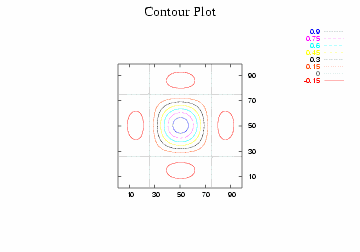
等高線図: splot
pi = acos(-1);
x = (-2*pi:2*pi:4*pi/99)';
y = matrix(-2*pi:2*pi:4*pi/99);
gr1 = (sin(x)*sin(y))/(x*y);

splot("set style data line\n \
       set nosurface \n \
       set contour\n \
       set size square \n \
       set view 0,0,,\n \
       set cntrparam level incr -0.15,0.15,0.9\n \
       set hidden3d"; gr1);

replot("set title 'Contour Plot' font 'Roman,28' \n \
        set xtics 10,20,100\n \
        set ytics 10,20,100");
replot("set term postscript eps color\n \
        set out 'contour.eps'");
|
マルチプロット: n/a
plot(;;N) により起動する gnuplot を複数指定できます. |
