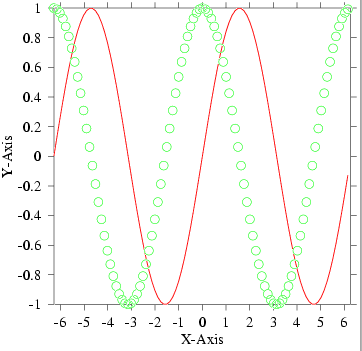
2次元グラフ: draw curve (symbol)
set y name "Y-Axis" set x name "X-Axis" \xmin = "-6.28" \xmax = "6.28" \xinc = "6.28 / 50" \function = "sin(x)" set font to Times set font size 14 set x axis -6.28 6.28 1 create columns from function draw axes set color red draw curve open cos.dat read columns x y close set symbol size 0.3 set color green draw symbol circ |

3次元グラフ: n/a
set font size 0 draw axes set font size 26 set font color rgb 0 0.5 0 set font to HelveticaBold draw label "Sorry! " at 0.2 6 draw label "Gri can't draw 3D plot." at 0.2 5 |

等高線図: draw contour
set x name "X-axis" set y name "Y-axis" set x axis -6.28 6.28 1 set y axis -6.28 6.28 1 set font to Times set font size 14 draw axes set x grid -6.28 6.28 0.3 set y grid -6.28 6.28 0.3 open contour.dat read columns x y z close convert columns to grid set font to Helvetica set font size 10 set color red draw contour -1 1 0.1 |

マルチプロット: set margin
# plot2d set x size 4.5 set x margin 2 set y size 4.5 set y margin 8 set x axis -6.28 6.28 1 set y axis -1 1 0.2 \xmin = "-6.28" \xmax = "6.28" \xinc = "6.28 / 50" \function = "sin(x)" create columns from function set font to Times set font size 10 draw axes set color red draw curve open cos.dat read columns x y close set symbol size 0.3 set color green draw symbol circ # contour set x margin 2 set y margin 2 set x axis -6.28 6.28 1 set y axis -6.28 6.28 1 set x grid -6.28 6.28 0.3 set y grid -6.28 6.28 0.3 set color black draw axes open contour.dat read columns x y z close convert columns to grid set font to Helvetica set font size 5 set color red draw contour -1 1 0.1 # plot3d set x axis 0 10 5 set y axis 0 10 5 set x margin 7.5 set y margin 8 set font size 0 draw axes set font size 14 set font color rgb 0 0.5 0 set font to HelveticaBold draw label "Sorry! " at 0.2 6 draw label "Gri can't draw 3D plot." at 0.2 5 |
