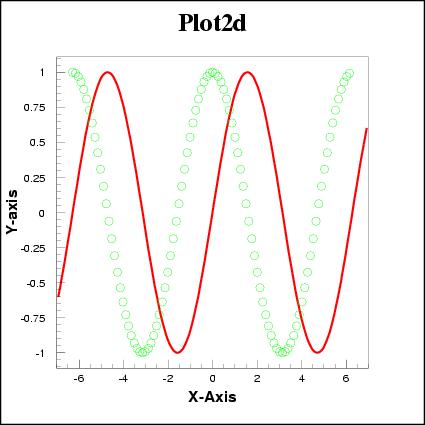
2次元グラフ: fun/plot, hplot/symbols
title_global 'Plot2d' color 1 0 0 0 vec/read x,y cos.dat fort/file 4 plot2d.eps gra/meta 4 -113 set hcol 2 set hwid 8 fun/plot sin(x) -7 7 color 1 0 1 0 hplot/symbols x y 100 24 0.3 color 1 0 0 0 atitle X-Axis Y-axis ! 220 close 4 |

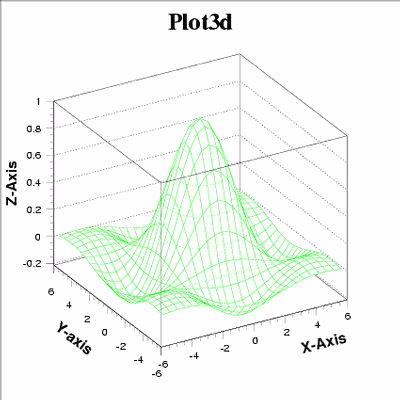
3次元グラフ: fun/fun2, hist/plot id surf
title_global 'Plot3d' fort/file 4 plot3d.eps metafile 4 -113 set hcol 3 fun2 100 sin(x)*sin(y)/x/y 25 -6 6 25 -6 6 atitle X-Axis Y-axis Z-Axis 002 close 4 |

等高線図: hist/plot id cont
title_global 'Contour Plot' fun2 100 sin(x)*sin(y)/x/y 25 -6 6 25 -6 6 fort/file 4 contour.eps graph/meta 4 -113 hist/plot 100 cont0 atitle X-Axis Y-Axis ! 220 fort/close 4 |

マルチプロット: zone n m
title_global 'Multi Plot' vec/read x,y cos.dat set ncol 16 pal 1 fort/file 4 multi.eps gra/meta 4 -113 zone 2 2 *** plot2d set hcol 2 fun/plot sin(x) -7 7 hplot/symbol x y 100 24 0.15 *** plot3d set hcol 12 fun2 200 sin(x)*sin(y)/x/y 25 -6 6 25 -6 6 *** contour hist/plot 200 cont0 *** shading set hcol 9 hist/plot 200 surf4 fort/close 4 |
