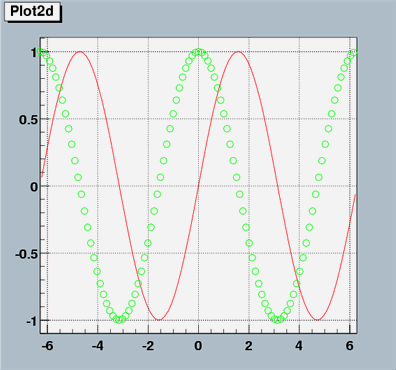
2次元グラフ: TF1, Tgraph, etc.
{
#include <fstream.h>

Double_t x[200],y[200];
Int_t i=0;
Double_t PI=4*atan(1);

ifstream data("cos.dat");
while(!data.eof()){data >> x[i] >> y[i];i++;}
data.close();

gStyle->SetCanvasColor(33);
gStyle->SetFrameFillColor(19);

TCanvas c1("c1", "Plot2d", 0, 0, 384, 384);
c1.SetGrid();

TF1 f1("f1","sin(x)",-2*PI,2*PI);
f1.SetLineColor(2);
f1.SetLineWidth(3);
f1.SetTitle("Plot2d");
f1.Draw();

TGraph dg1(--i,x,y);
dg1.SetMarkerStyle(24);
dg1.SetMarkerColor(3);
dg1.SetMarkerSize(1.5);
dg1.SetTitle("plot2d");
dg1.Draw("P");

c1.Update();
c1.GetFrame().SetBorderSize(4);
c1.Modified();

c1.Print("plot2d.eps");
}
//  使い方
//
//  root plot2d.C     <-- 拡張子は大文字の C です
//
|

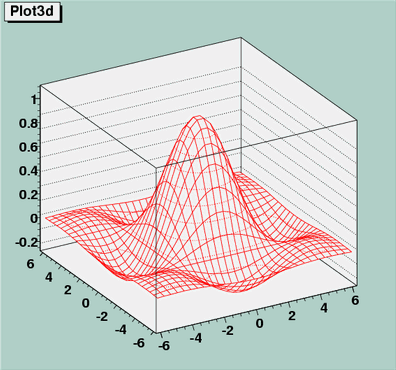
3次元グラフ: TF2,etc.
{
Double_t PI=4*atan(1);
gStyle->SetCanvasColor(29);
gStyle->SetFrameFillColor(19);

TCanvas c1("c1", "Plot3d", 0, 0, 384, 384);
//c1.SetPhi(-120);
//c1.SetTheta(30);

TF2 f1("f1","sin(x)*sin(y)/x/y",-2*PI,2*PI, -2*PI, 2*PI);
f1.SetTitle("Plot3d");
f1.SetLineColor(2);
f1.SetContour(10);
f1.Draw("surf");

c1.Print("plot3d.eps");
}
|

等高線図: TF2, etc.
{
Double_t PI=4*atan(1);

gStyle->SetCanvasColor(21);
gStyle->SetFrameFillColor(19);

TCanvas c1("c1", "Plot3d", 0, 0, 384, 384);
//c1.SetGrid();

TF2 f1("f1","sin(x)*sin(y)/x/y",-2*PI,2*PI, -2*PI, 2*PI);
f1.SetTitle("Contour Plot");
f1.SetContour(10);
f1.Draw("cont1");

c1.Update();
c1.GetFrame().SetBorderSize(4);
c1.Modified();

c1.Print("contour.eps");
}
|

マルチプロット: Tcanvas->Divide, etc.
{
#include  $lt;fstream.h>

Double_t x[200],y[200];
Int_t i=0;
Float_t x1=0.65,x2=0.895,y1=0.91,y2=0.99;

Double_t PI=4*atan(1);

ifstream data("cos.dat");
while(!data.eof()){data >> x[i] >> y[i];i++;}
data.close();

gStyle->SetCanvasColor(29);
gStyle->SetFrameFillColor(19);

TPaveLabel pl;

TCanvas c1("c1", "Plot2d", 0, 0, 480, 480);
TF1 f1("f1","sin(x)",-2*PI,2*PI);
TGraph dg1(--i,x,y);
TF2 f2("f2","sin(x)*sin(y)/x/y",-2*PI,2*PI, -2*PI, 2*PI);

c1.Divide(2,2);
c1.SetFillColor(33);

c1.cd(1);
f1.SetLineColor(2);
f1.SetLineWidth(3);
f1.SetTitle("");
f1.Draw();
dg1.SetMarkerStyle(24);
dg1.SetMarkerColor(3);
dg1.SetMarkerSize(1.0);
dg1.SetTitle("plot2d");
dg1.Draw("P");
pl.DrawPaveLabel(x1,y1,x2,y2, "Plot2d", "NDC");

c1.cd(2);
f2.SetTitle("");
f2.SetLineColor(2);
f2.SetContour(10);
f2.Draw("surf");
pl.DrawPaveLabel(x1,y1,x2,y2, "SURF", "NDC");

c1.cd(3);
f2.Draw("cont1");
pl.DrawPaveLabel(x1,y1,x2,y2, "CONT1", "NDC");

c1.cd(4);
f2.SetFillColor(38);
f2.Draw("surf4");
pl.DrawPaveLabel(x1,y1,x2,y2, "SURF4", "NDC");

c1.Print("multi.eps");
}
|
