plotの種類
図の種類を指定するオプション
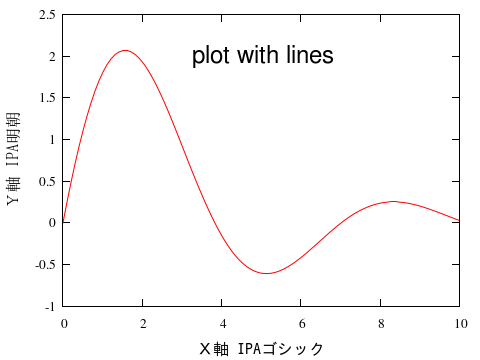
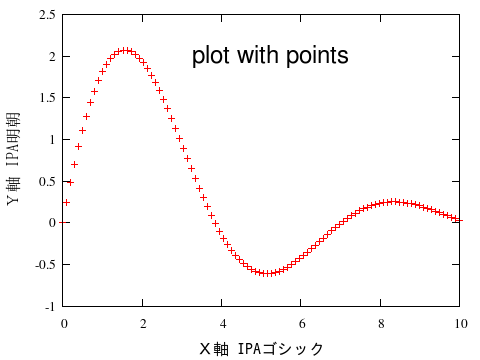
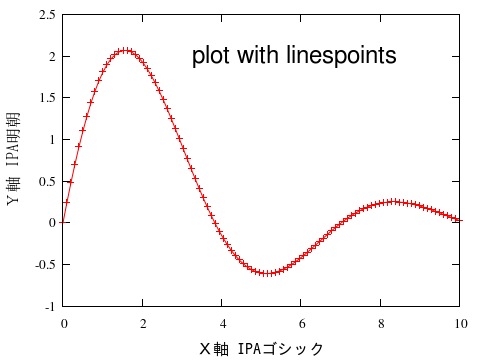
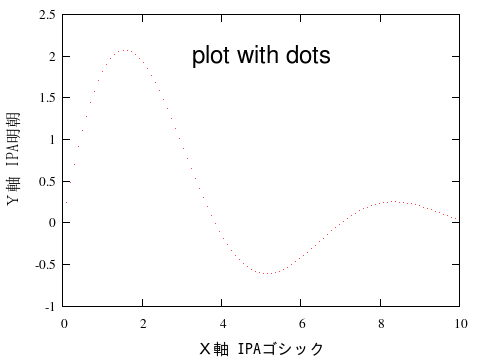
with styleで,数値データを表
現する
styleには現在(Ver.4.6.1),次のものを選択できます.
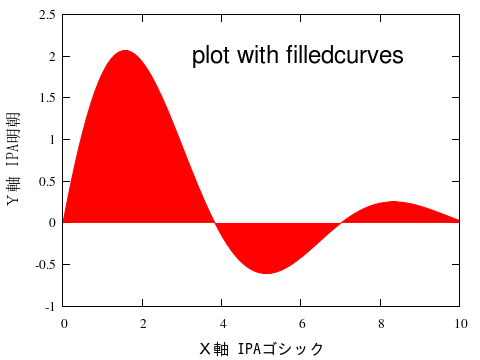
lines(l), points(p), linespoints(lp), vectors(vec), filledcurves(filledc),
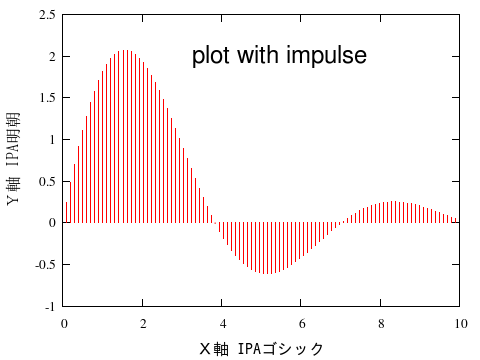
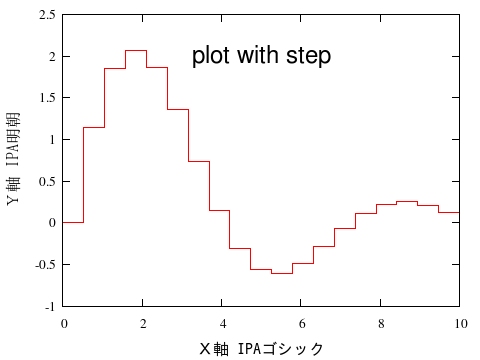
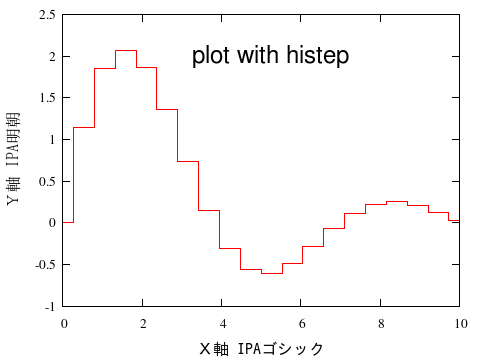
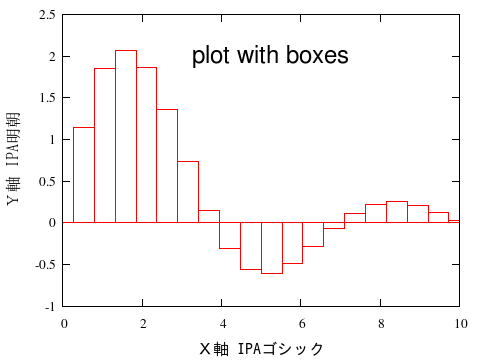
histograms(hist), boxes, dots(d), impulses(i), steps(st),
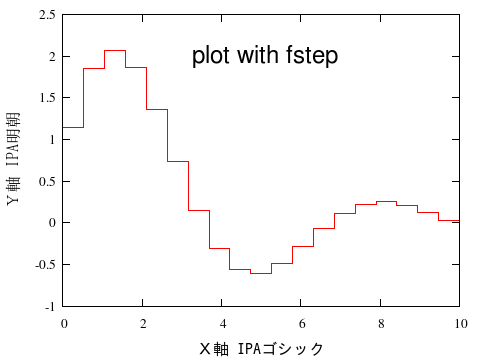
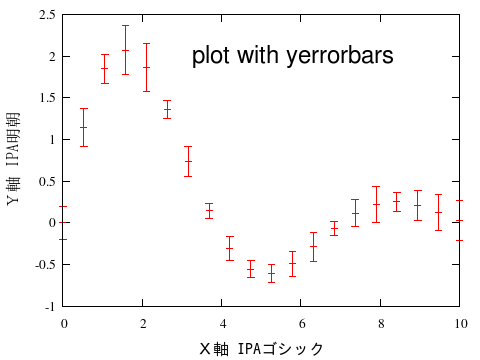
fillsteps(fillst),fsteps(fst),histeps(his), errorbars(e),
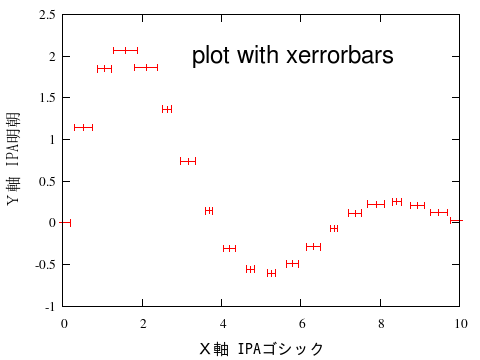
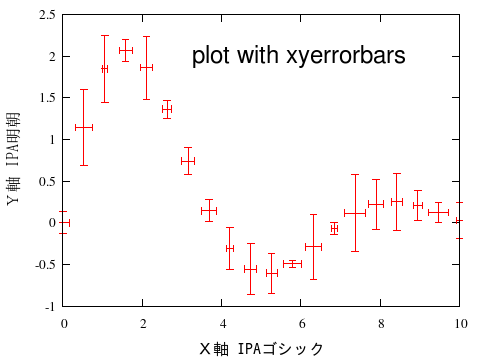
xerrorbar(xer), yerrorbars(yer), xyerrorbars(xye),
errorlines(errorl), xerrorlines(xerrorl), yerrorlines(yerrorl),
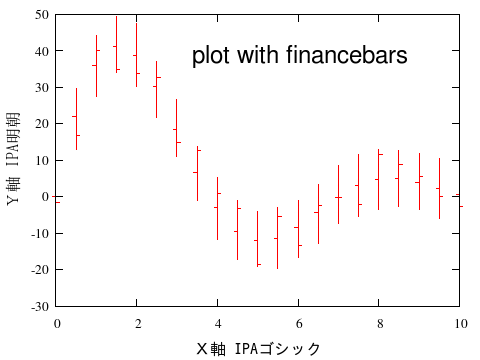
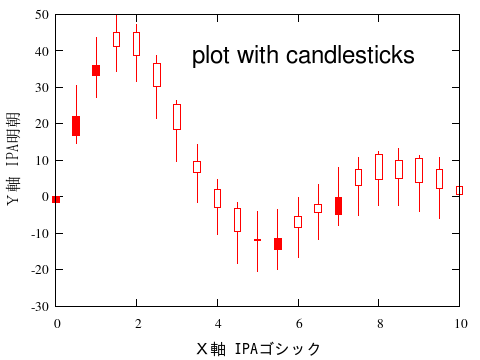
xyerrorlines(xyerrorl), financebars(fin), candlesticks(can),
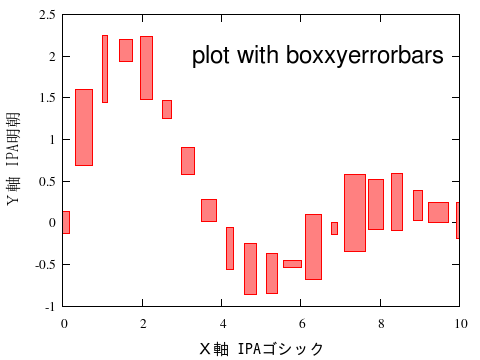
boxerrorbars(boxer), boxxyerrorbars(boxx), boxplot,
circles(cir), ellipses(ell), rgbimage(rgbima), rgbalpha(rgba), lables
gnuplotでは識別が可能であれば省略名を用いることができ,括弧内は最大限省
略した場合の記述文字を示しています(ただし,'hist' は 'histograms'
に解釈されます.詳しくは,ソースのtable.cを参照).
なお,一般には末尾側から省略していくのですが,linespointsだけは例外的に,途中の省略を許しています.
基本的な図
誤差などの付加情報がある図
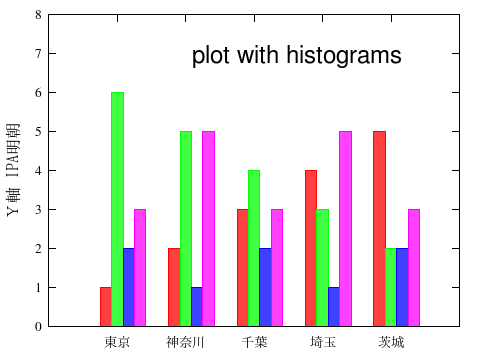
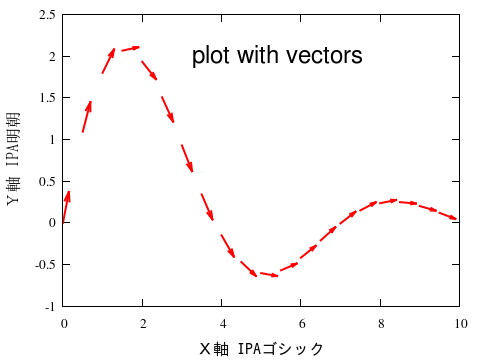
ヒストグラム,ベクトル線図
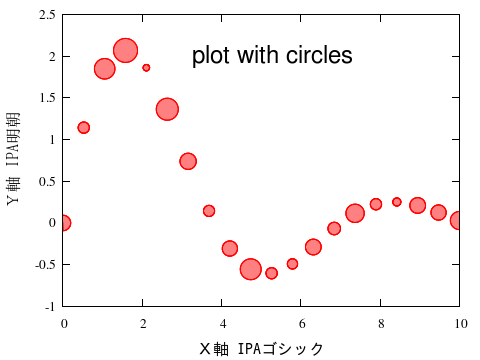
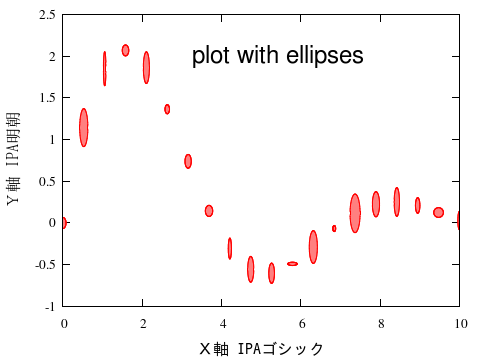
大きさをデータから指定する円,楕円
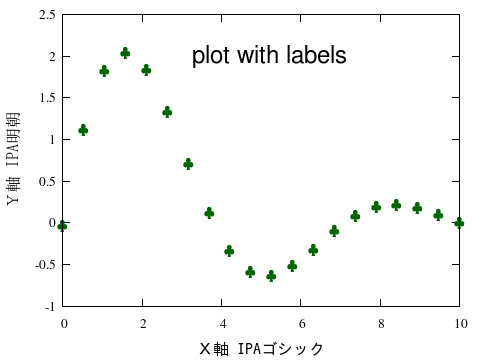
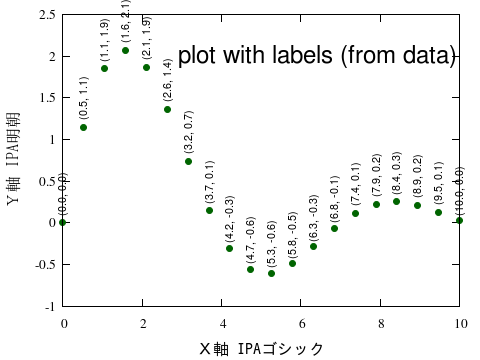
記号や文字列をデータから指定
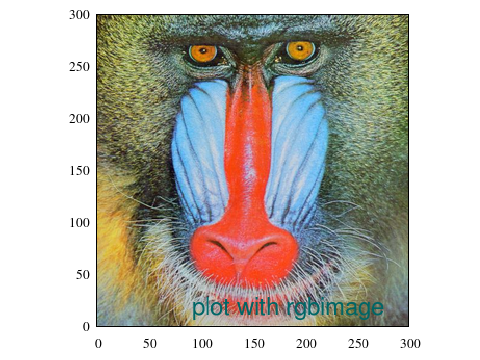
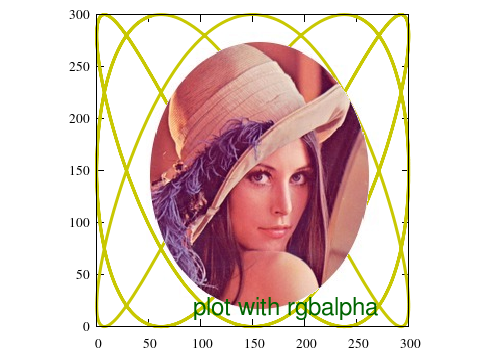
画像(gif,png,jpg)の表示